
Does a 1kW turbine generate 24kWh a day?
Only if it actually delivers 1kW continuously for all 24 hours. Its nameplate rating does not promise that. Output changes with wind speed and operating conditions. To estimate energy, combine the turbine’s power curve with the time your site spends at different wind speeds, then account for relevant losses and downtime.
A compact wind turbine advertised as “1,000 watts” can sound like a steady electricity supply for a workshop or small home. But the number leaves out the most useful question: how often will the wind at your proposed turbine position produce that output?
Reading the power curve helps you move beyond the headline. This guide explains the graph, works through a deliberately simplified example and shows what information to request before comparing quotations. None of the example figures below describe a tested commercial turbine.
1. Separate power from energy
A kilowatt, written kW, measures power: the rate of electricity generation or use. A kilowatt-hour, written kWh, measures energy accumulated over time.
If a turbine delivers 0.2kW for five hours, it generates 1kWh. If it delivers 1kW for ten minutes, it generates about 0.167kWh. The brief higher reading is impressive, but the longer period contributes more energy.
The basic calculation
Energy in kWh = average power in kW × time in hours.
For changing output, calculate the energy for each period and add the results. Do not multiply the largest reading you have seen by every hour of the day.
This distinction matters when deciding what the turbine can do. An appliance’s power requirement and its daily energy consumption answer different questions. A battery may bridge gaps, but it cannot create energy the turbine has not supplied.
2. Read the axes before reading the headline
A power curve plots wind speed along the horizontal axis and electrical output along the vertical axis. Check whether speed is in metres per second, miles per hour or kilometres per hour, and whether output is in watts or kilowatts. One kW equals 1,000W; 1m/s is approximately 2.24mph.
To read a point, find the wind speed, move up to the curve and then across to the output scale. Ask where that output is measured: at the generator, controller or grid-connected inverter? The answer affects which additional losses belong in your calculation.
The ICC Small Wind Certification Council’s comparison table distinguishes rated power from peak power. Its explanation of AWEA ratings uses output at 11m/s for rated power, while peak power is the highest point on the certified curve. A model’s advertised name may use a different nominal figure. Always check the actual definition behind “1kW”.
3. Identify the important parts of the curve
- Below cut-in: there is insufficient wind for useful electrical generation. Seeing blades rotate does not establish useful output.
- The rising section: output increases as wind strengthens. Read several points here, especially at speeds common at your site.
- Rated output: the stated rating is reached under the specified conditions; it is not a daily average.
- Strong-wind behaviour: output may be limited, reduced or stopped by the turbine’s protection system.
The Department of Energy’s power-curve explanation shows a rising section, a rated plateau and eventual shutdown for a typical controlled turbine. Small turbines do not all share that shape. Some use furling or other regulation; obtain the exact model’s documented behaviour rather than assuming every curve has a flat top.
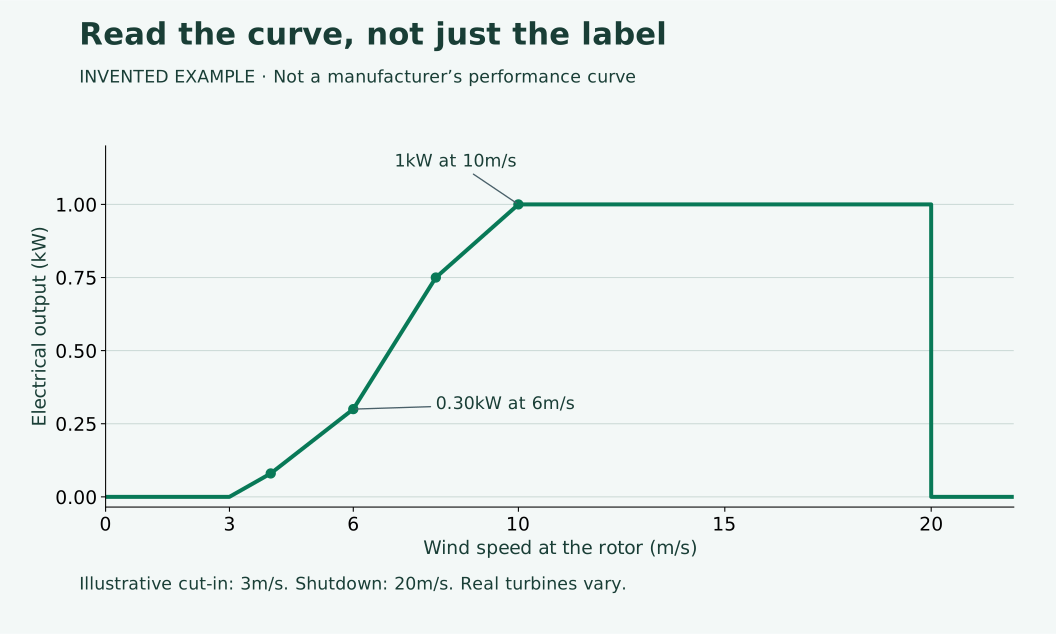
Do not extend the rising line indefinitely. A storm is not a promise of unlimited electricity, and protective shutdown is not necessarily a fault. Never defeat a protection mechanism to try to increase production.
Optional paid reading: If you are exploring broader energy ideas, you can view the linked energy offer. It is not a verified wind-turbine performance guide or a recommendation for particular equipment.
4. Turn a curve into a daily energy estimate
For this example, imagine the following wind speeds remain steady within each group of hours. Read the corresponding power from our invented curve, multiply by the hours and total the energy.
| Wind speed | Hours | Assumed output | Energy |
|---|---|---|---|
| 2m/s | 8 | 0kW | 0kWh |
| 4m/s | 8 | 0.08kW | 0.64kWh |
| 6m/s | 5 | 0.30kW | 1.50kWh |
| 8m/s | 3 | 0.75kW | 2.25kWh |
| Total | 24 | — | 4.39kWh |
The average output is 4.39 ÷ 24 = approximately 0.183kW, or 183W. Nothing has “gone missing” from a promised 1kW supply: the wind never reached the rating point during this fictional day.
The three hours at 8m/s contribute more energy than the thirteen hours at 4m/s and 6m/s combined. That is why knowing how long the wind spends in each speed range matters.
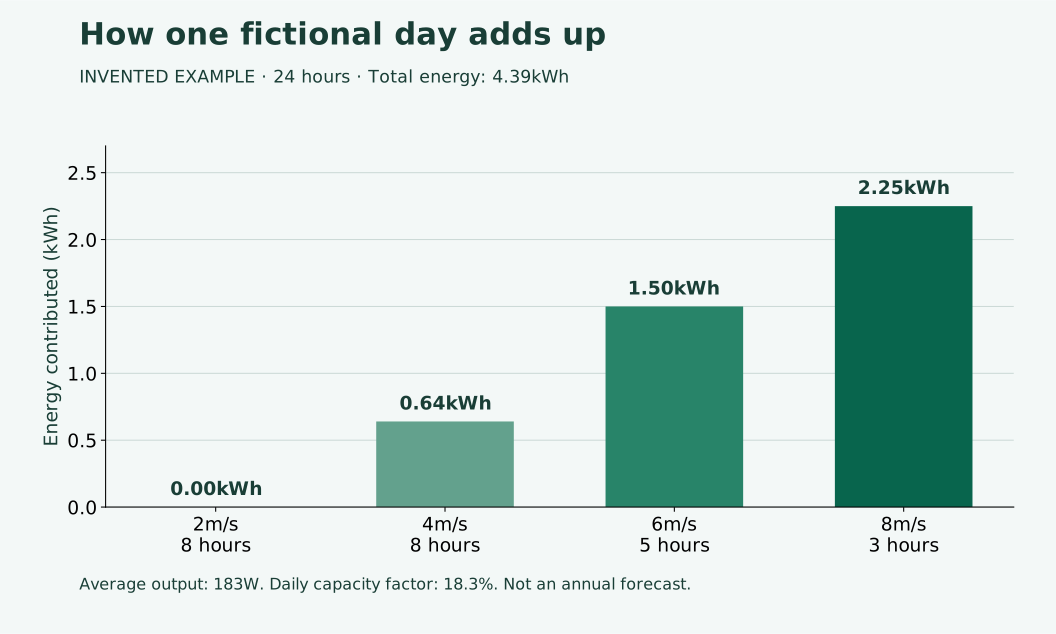
Real assessments normally use wind-speed bins or time-series data rather than four perfectly steady blocks. Narrower bins reduce simplification, but data quality and the suitability of the power curve still matter.
5. Why average wind speed is not enough
Consider two invented two-hour periods. In the first, wind stays at 4m/s, giving 0.08kW × 2 hours = 0.16kWh. In the second, wind is 2m/s for one hour and 6m/s for one hour, giving 0 + 0.30 = 0.30kWh.
Both average 4m/s, yet the energy totals differ. These idealised blocks demonstrate the arithmetic; they do not imply that rapid gusts necessarily improve a real turbine’s performance.
A published study of turbine power-curve modelling describes how technical design and environmental factors, including turbulence and air density, influence the curve. Treat a smooth line as a performance relationship under stated conditions, not a guarantee for every gust.
Ask an assessor how the wind-speed distribution was obtained. Was it measured, modelled or assumed from an average? That single question makes a forecast easier to judge.
6. Use capacity factor carefully
Capacity factor compares actual energy over a period with the energy that continuous operation at the chosen rated power would produce.
Example daily capacity factor = 4.39kWh ÷ (1kW × 24 hours) ≈ 18.3%.
This is not conversion efficiency, nor the percentage of time the blades turn. It summarises energy relative to the rating. State both the period and the rating used when comparing figures.
A non-leap year contains 8,760 hours, so a hypothetical 1kW system with a 20% annual capacity factor would generate 1,752kWh. That is a conditional calculation, not a forecast or a recommended assumption. Do not annualise our fictional day or borrow a wind farm’s capacity factor for a garden turbine.
7. Match the evidence to your proposed location
The DOE Small Wind Guidebook recommends estimating annual energy using the turbine’s curve, site wind conditions, tower height and local siting characteristics. It also explains that broad wind maps cannot resolve all local features.
A weather-app reading, an exposed coastal station and a sheltered garden are different evidence sources. Request an estimate for the proposed rotor hub height, with the measurement height and any adjustment explained. Record nearby buildings and trees, including the direction from which they obstruct the wind.
Our wind-site log guide helps organise the information for an installer. The roof versus pole-mounted turbine guide explores why mounting position deserves attention before equipment selection.
Energy Saving Trust identifies exposed, windy locations as the better candidates, with built-up or sheltered settings less suitable. A larger nameplate number does not remove the need for a suitable site.
8. Ask for net output and visible assumptions
Before accepting an annual figure, ask what is already included. A curve measured after an inverter already includes that equipment’s performance; deducting the same loss again would understate output. Conversely, generator-terminal output is not automatically energy available to household appliances.
The DOE community wind handbook discusses cable losses and the importance of siting. Ask your installer to identify additional electrical losses, maintenance downtime, curtailment and any storage losses relevant to the proposed system.
Request a central estimate and a lower-output scenario, with the reasons for the difference. Then compare the net energy with when you actually need it. Annual generation alone cannot establish dependable overnight or off-grid supply; our reserve-planning guide explains the separate backup question.
You can also inspect the seller’s energy presentation as optional paid reading. Independently check its claims; promotional material is not a substitute for measured site data.
Questions to send with your quotation request
- What exact turbine, controller and inverter does this curve cover?
- Is the curve independently tested, and can I read the report?
- What wind speed defines the advertised rating?
- What wind data, hub height and distribution underpin the estimate?
- Where is output measured, and which losses are already included?
- What changes under a less windy year or longer downtime?
- What maintenance, access and complete installed costs are assumed?
Frequently asked questions
Does low cut-in speed mean high energy production?
No. Starting to generate at a low speed says little about how much energy is delivered there. Read the low-speed output values and the annual estimate.
Can two 1kW turbines generate different amounts?
Yes. Their curves, rating definitions, system configurations and site conditions can differ. Compare the complete evidence using consistent assumptions.
Does a spinning rotor prove the battery is charging?
No. Check the system’s supported electrical monitoring. Rotation alone does not establish net charging power.
Will a battery make the turbine produce more?
A battery stores available energy and may help you use it later. It does not improve the wind resource, and storage introduces its own operating limits and losses.
Buy on expected energy, not the biggest label
A useful quotation connects a documented power curve to credible wind data for your proposed location. Ask for the assumptions, inspect the lower-speed output and compare net annual energy with your needs. The 1kW label is a starting point, not the answer.
Explore the linked energy offer
Optional paid affiliate resource. We have not tested the product or verified its performance claims. Check the seller’s contents, price and terms before buying; it is not a turbine specification or site assessment.
View the energy offer — affiliate linkSources and further reading
Checked 7 October 2026. Both charts and all worked turbine figures are invented teaching examples, not measured performance.