
Quick answer
Cut-in wind speed marks the beginning of generation, not a promise of worthwhile battery charging. A rotor may turn before it delivers useful electrical power. Even after charging begins, a few watts may be smaller than the system's running loads. Judge a turbine by its power curve, measured watt-hours and your site's wind conditions—not by how often its blades move.
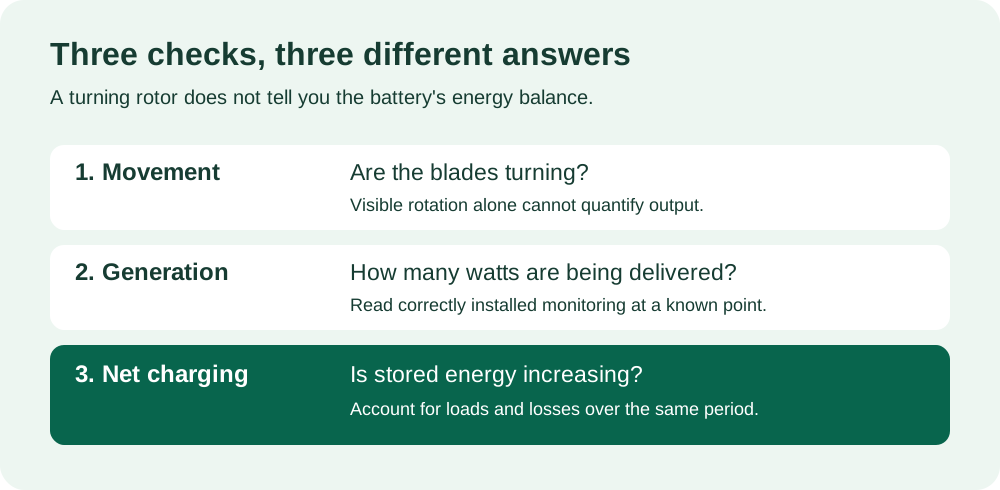
Watching a turbine spin is satisfying. Watching the battery percentage barely change is less encouraging. Both can happen at the same time without anything being broken. The missing piece is the difference between visible movement, electrical output and energy actually stored.
For a shed, allotment or off-grid cabin, the practical question is simple: how much energy reaches your equipment over a day, and is that enough for the job?
Three milestones that are easy to confuse
Starting to rotate means the wind has overcome the resistance needed to move the blades. It does not establish how much electrical load the machine can supply.
Electrical cut-in is the wind speed where generation begins under the specified conditions. The US Department of Energy's Small Wind Guidebook distinguishes cut-in speed from rated power and rated wind speed. Product descriptions sometimes use “start-up” loosely, so ask exactly what the quoted threshold measures.
Useful charging depends on your purpose. Five watts might contribute to a small, intermittent lighting load. It is a very different proposition if you expect to replace a laptop's daily energy use. There is no universal wind speed at which every turbine suddenly becomes useful.
Why a gentle breeze contains so little power
With the same air density and rotor swept area, the power available in wind scales with wind speed cubed. Doubling wind speed gives eight times the available wind power. Halving it leaves one-eighth. This explains why a machine can look active in a light breeze yet deliver little electricity.
That relationship describes the wind resource, not an exact electrical prediction. A real turbine's efficiency, controller and operating limits change with conditions. You cannot take its advertised maximum wattage and apply a cube calculation across every speed.
A useful manufacturer example comes from Marlec's Rutland VertX 360 specifications: a 3m/s cut-in speed is listed alongside 5W at 5m/s, 46W at 11m/s and 92W at 15m/s. These are published figures for that particular model, not our test results or a recommendation to buy it. They show why the cut-in number alone tells you so little about subsequent output.
For reference, 3m/s is approximately 6.7mph or 10.8km/h. Keep units consistent when comparing a turbine brochure with local weather records.
Read the curve where your wind actually occurs
A power curve plots electrical output against wind speed. Compare the output across the speeds your proposed site commonly experiences, rather than concentrating on one impressive maximum. Our 1kW wind turbine power-curve guide explains that comparison in more detail.
Ask the supplier where output was measured: at the generator, after the controller, or elsewhere? Ask which controller and battery voltage were used, whether the figures were independently tested, and which losses are included. Two curves may appear comparable while describing different measurement boundaries.
Do not multiply the turbine's rating by 24 hours to estimate a day's production. Nor does an annual average wind speed reveal how many hours were calm, moderate or strong. An energy estimate needs the frequency of different speeds, the relevant curve and realistic availability.
A spinning turbine can still leave an energy deficit
Here is an invented day for a small system. The figures are average DC power delivered by the wind controller to the shared battery-and-load bus during each period. They are not a real turbine's power curve or a site forecast.
| Time at this output | Average delivered power | Energy delivered |
|---|---|---|
| 12 hours | 0W | 0Wh |
| 8 hours | 5W | 40Wh |
| 3 hours | 30W | 90Wh |
| 1 hour | 100W | 100Wh |
| Total: 24 hours | — | 230Wh |
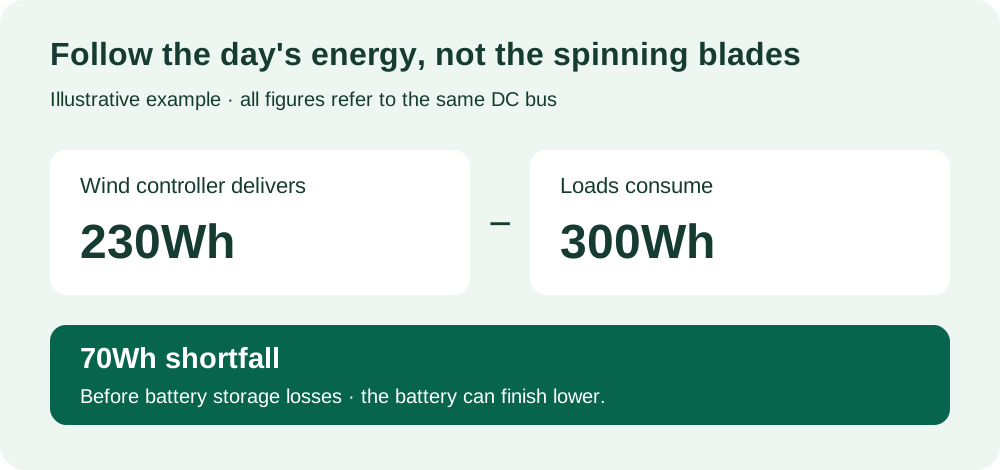
The calculation is watts multiplied by hours. If loads draw 300Wh from that same bus during the day, generation is 70Wh short before allowing for battery storage losses. The battery can finish lower even though the turbine generated electricity for half the day.
Do not subtract controller losses again if the meter already measures output after the controller. Equally, an appliance's AC energy reading may exclude inverter losses. Keep both generation and consumption on the same measurement basis before comparing them.
A second illustration: a monitored charging voltage of 14V and current of 0.2A gives just 2.8W. Sustained for six hours, that is 16.8Wh. These are calculation inputs, not recommended charging settings. A voltage reading alone cannot tell you how much energy is flowing.
Sometimes the battery is limiting charging
Low output does not always mean inadequate wind. A charged battery may need little additional energy. Controllers can deliberately reduce or stop charging rather than keep pushing power into storage.
The AIR Wind Power manufacturer FAQ, for example, describes regulation at a battery-voltage setpoint and explains that its turbines can turn slowly while charging is stopped. It also identifies cable voltage drop and unsuitable metering as potential sources of misleading behaviour. These details are model-specific; use your own equipment's instructions.
Record the controller's operating state alongside its watts or amps. “Charging”, “regulated”, “stopped” and an error indication tell different stories. If another source such as solar is charging the same bank, the wind controller may also be responding to that battery condition.
A battery percentage display is useful for trends, but is not a substitute for an energy log. Rounding and estimation can hide small changes, particularly on a large battery.
The wind at the rotor matters
Energy Saving Trust's guidance favours exposed, consistently windy locations over sheltered or built-up sites. A weather app describing the wider area cannot establish the airflow behind your shed or between your trees.
Start with our guide to small turbines in gardens surrounded by trees. If the proposed position is sheltered, a lower advertised cut-in speed does not establish that the purchase will be worthwhile.
Keep a wind-site log for an installer covering the intended position, obstacles, wind direction, observed output and your intended loads. Short observations can reveal questions worth investigating; a windy weekend cannot establish annual yield. Discuss representative monitoring with a competent assessor before committing to a tower.
A practical check before buying more equipment
- Define the job. List the lights, chargers and other loads, with their daily watt-hours.
- Identify the measurement point. Confirm whether the display reports wind input, controller output or net battery flow.
- Read the status. Note battery state, controller messages and other charging sources.
- Log a complete period. Compare daily energy totals and operating conditions, not the highest number in one gust.
- Compare like with like. Check the correct model's curve, voltage and controller assumptions with the supplier.
- Escalate unexplained results. Give the manufacturer or installer your records and any fault codes.
Use existing, correctly installed monitoring and ground-level observations. Do not disconnect a running turbine, bypass its controller, alter protection settings or improvise live electrical tests to make the numbers increase. Wind systems need the manufacturer's specified control and stopping arrangements.
Which recommended products fit this decision?
For beginners, our DIY Alternative Energy Projects bundle is the most natural starting point. The £9.99 digital package combines an introductory ebook, seven small projects and printable planning materials. Use it to organise your loads, questions and next steps before purchasing generating equipment. Its small wind-to-light activity is a learning demonstration, not a test of a garden's annual wind resource.
If your real requirement is stored electricity for occasional shed use, our Anker SOLIX C2000 Gen 2 and FOSSiBOT F2400 product guides offer alternatives to investigate. Choose storage around your measured loads and an approved way to recharge it. A larger battery will not correct a persistent shortage of generation.
These links are not a claim of wind-input compatibility. A portable power station's solar input is not automatically suitable for a wind turbine. Only use an arrangement explicitly supported by the relevant manufacturers; otherwise consider the station separately with its approved charging sources.
Frequently asked questions
Is a lower cut-in speed always better?
It can extend the conditions in which generation begins, but says little about the amount produced. Compare the complete output data and expected energy at your site.
Can the turbine charge while the battery percentage falls?
Yes. Loads can consume more power than the turbine supplies. Net battery flow and daily watt-hours explain this better than rotor movement.
Will adding a battery improve weak-wind output?
It provides storage, not extra wind energy. Our generation-versus-storage guide helps distinguish a supply shortage from a timing problem.
What should I ask before ordering a turbine?
Request a power curve, site-specific energy estimate, compatible system design and total installed cost. Ask how low-wind output and battery regulation were accounted for.
Plan the energy you need before choosing equipment
Start with your daily loads, then compare realistic generation and storage. Our DIY Alternative Energy Projects bundle gives you beginner projects and printable tools to help organise that work.
Explore the DIY bundle — £9.99